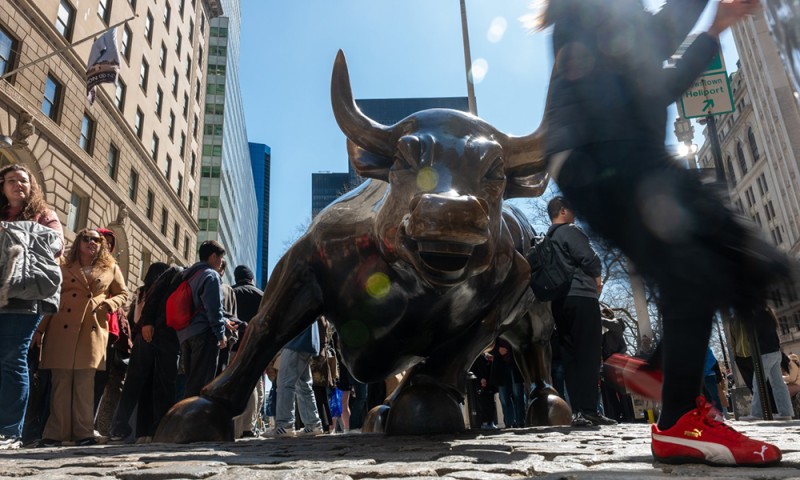
数周前标普500指数创下历史新高时,笔者曾指出该指数几乎触及里程碑数值——市盈率达30倍。不过,当时我有点“投机取巧”了,正如在那篇文章里提及的:实际市盈率约为29.85倍,只因数值接近整数,四舍五入后便成了30。关键在于,这一数字处于极高水平,然而华尔街分析师和评论员却鲜少提及——他们更倾向于引用基于“明年利润”(这一数据通常被高估)或“营业利润”(剔除利息支出等基本费用)计算得出的更低、更具市场吸引力的市盈率。
但如今,这一数据已载入史册:8月28日下午2点35分,标普500指数攀升至6501点的新高,实际(未经四舍五入的)市盈率达到30倍。该比率基于最关键的指标——过去四个季度依据公认会计准则(GAAP)核算的收益,即实实在在已实现的利润,而非通常过于乐观的预测。近几十年来,唯有1999年第四季度至2022年第一季度科技狂潮席卷市场的十个季度里,大盘股估值曾达到如此高位。(疫情期间及全球金融危机后,市盈率也曾短暂超过30倍,但那只是因为盈利大幅下滑,导致分母数值缩水,使得市盈率被人为推高。)
正如我所指出的,宏观层面危险信号正不断增多。美国劳工统计局最新就业报告显示,7月美国仅新增7.3万个就业岗位,同时大幅下调5月和6月数据,使得过去三个月净增就业岗位总数仅为10.6万个,还不到去年同期增幅的四分之一。海军联邦信贷联盟(Navy Federal Credit Union)首席经济学家希瑟·朗(Heather Long)将这一疲软数据称为“局势逆转点”,直言这表明“劳动力市场正在迅速恶化”。
国内生产总值增长同样令人失望,远低于特朗普政府雄心勃勃的3%的目标。2025年上半年,经济年化增长率仅为1.75%,较去年三、四季度2.7%的平均增速大幅回落。国会预算办公室(CBO)预测2026至2035年经济增速将维持在1.7%-1.8%的低位,远不足以缩减联邦债务——该机构预计联邦债务占国民收入的比例将从今年的100%攀升至2031年的110%。
那么这对当下的投资者意味着什么?市盈率达到30倍,意味着投资者每向标普500成份股投入100美元,仅能获得3美元收益。而就在2022年底,同样投入100美元,还能获得5美元收益。股价飙升并非源于盈利激增——自那以后,盈利增长甚至难以抵消通胀。近年来股价暴涨纯粹源于市盈率飙升,使得股票变得愈发昂贵。这并非预示股市明日、下周或下月必将崩盘,但历史反复证明:当估值攀升至如此高位时,终将回归合理水平。(*)
译者:中慧言-王芳
A few weeks ago as the S&P 500 hit a new record, this reporter noted that the index virtually hit a landmark reading, a price to earnings ratio of 30. I actually cheated a bit, as I pointed out in the piece: The actual figure was around 29.85, close enough that I rounded it to 30. The point then was, this is a big, big number that you seldom see mentioned by Wall Street analysts or pundits, who’d rather cite a lower, more marketable multiple based on “next year’s” (always over-estimated) profits or “operating earnings” that exclude real charges as basic as interest expense.
But now it’s in the record books: At 2:35 PM on August 28, the S&P hit another fresh summit at 6501, and the real, not-rounded-up PE hit 30. That ratio’s based on what matters most, GAAP earnings posted over the last four quarters, profits that really happened as opposed to usually over-rosy predictions. The only span in recent decades when big cap stocks have been this expensive: Ten quarters during the tech frenzy that stretched from Q4 of 1999 to Q1 of 2022. (The PE also briefly exceeded 30 during the pandemic and following the GFC, but only because earnings collapsed, sinking the denominator and skewing the multiple artificially low.)
As I noted, on the macro scene, the danger signs are multiplying. The latest employment report from the Bureau of Labor Statistics disclosed that the U.S. added a meager 73,000 jobs in July, and revised the May and June figures radically downward, bringing total net hires for the past three months to just 106,000, less than one fourth the increase for the same period last year. Heather Long, chief economist at Navy Federal Credit Union, described the feeble data as a “game changer” demonstrating that “the labor market is deteriorating quickly.”
GDP growth has also proved disappointing, clocking far below the Trump administration’s highly aspirational target of 3%. The economy expanded at an annualized clip of just 1.75% through the first half of 2025, way down from the 2.7% average in Q3 and Q4 of last year. The Congressional Budget Office (CBO) is forecasting tepid expansion of 1.7% to 1.8% from 2026 to 2035, not nearly fast enough to shrink the federal debt that the agency projects will swell from 100% of national income this year to 110% by 2031.
So what does that mean for investors now? A 30 PE means you’re getting only $3 in earnings for every $100 you pay for S&P stocks. As recently as late 2022, you were getting $5 for every $100 invested. And the jump in stock prices didn’t occur because earnings soared. Since then, they’ve barely matched inflation. No, the huge ramp in recent years came strictly because PEs jumped, making stocks more and more expensive. That doesn’t mean stocks will crash tomorrow, or next week or next month. But history has proved time and time again that when valuations rise this far into the stratosphere, they are bound to come back to earth eventually.

